
Introduction
In this blog post, we will explore how to extract data from PDF files using the tabulapdf package in R. PDF is a common file format for sharing data, but extracting structured data from PDFs can be challenging. The tabulapdf package provides an easy way to extract tables from PDFs and convert them into a usable format.
Importance of Extracting Data from PDFs
Extracting tables from PDF files is crucial for several reasons:
- Data Accessibility: Many important documents and reports are shared in PDF format. Extracting data from these documents makes it accessible for analysis and further use.
- Automated Data Processing: Manual data entry from PDFs is time-consuming and prone to errors. Automated extraction ensures accuracy and efficiency.
- Data Integration: Extracting data from PDFs allows for the integration of information from various sources, enhancing the comprehensiveness of data analysis.
- Historical Data Analysis: Many historical documents are available only in PDF format. Extracting data from these PDFs allows for the analysis of trends over time.
- Enhanced Decision Making: Having access to data in an analyzable format helps in making informed decisions based on comprehensive data analysis.
So extracting tables from PDFs is a critical skill that enables access to important data, ensures accuracy, and saves time in data processing.We can automate the process and make the data extraction workflow more efficient. This not only improves productivity but also ensures that the data extracted is accurate and reliable, providing a solid foundation for any subsequent analysis or decision-making processes.
Given these reasons, it’s evident why efficient tools for extracting data from PDFs are invaluable. So lets learn how to extract data from PDFs using the tabulapdf package in R.
Required Libraries
I have tried tabulizer to install but not successful. I have come across tabulapdf package and find it very handy. To begin, we’ll need to install and load the necessary libraries. Here is the list of packages we’ll be using:
rJavatabulapdfpdftoolstidyverse
Let’s load these libraries in R.
Extracting Tables from a PDF
The extract_tables function extracts tables from the specified page of the PDF file. In this case, we extracted the table from the first page of the sample PDF file.
Code
f2 <- "https://raw.githubusercontent.com/ropensci/tabulapdf/main/inst/examples/mtcars.pdf"

extract_tables(f2, pages = 1) [[1]]
# A tibble: 5 × 12
model mpg cyl disp hp drat wt qsec vs am gear carb
<chr> <dbl> <dbl> <dbl> <dbl> <dbl> <dbl> <dbl> <dbl> <dbl> <dbl> <dbl>
1 Mazda RX4 21 6 160 110 3.9 2.62 16.5 0 1 4 4
2 Mazda RX4 W… 21 6 160 110 3.9 2.88 17.0 0 1 4 4
3 Datsun 710 22.8 4 108 93 3.85 2.32 18.6 1 1 4 1
4 Hornet 4 Dr… 21.4 6 258 110 3.08 3.21 19.4 1 0 3 1
5 Hornet Spor… 18.7 8 360 175 3.15 3.44 17.0 0 0 3 2Table 1 indicates that the table has been successfully extracted from the PDF file. We can now proceed to convert this table into a data frame for further analysis.
Now we will extract a table from a specific page of another PDF file. This PDF is a monthly report on Consumer Price Index from the Pakistan Bureau of Statistics.
Code
# URL of the monthly review PDF
f1 <- "https://www.pbs.gov.pk/sites/default/files/price_statistics/cpi/may/Monthly%20Review%20May%2C%202024.pdf"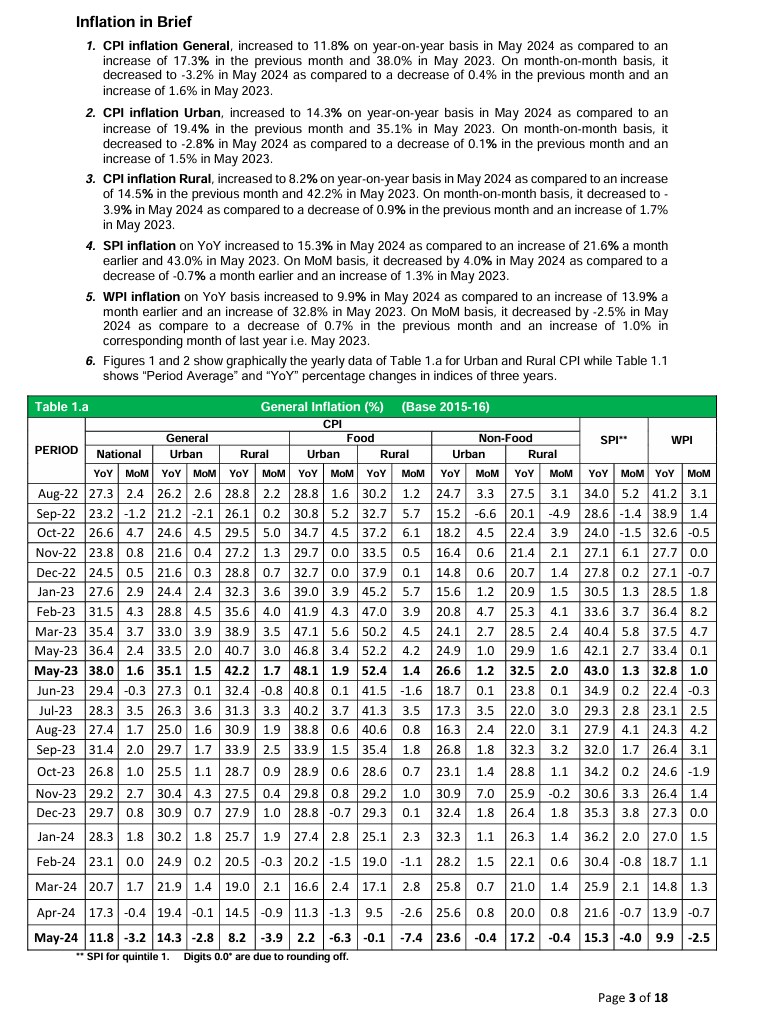
One can see from Figure 1 that the table we want to extract is on the third page of the PDF. Let’s extract the table from the third page of the PDF file.
Code
# Extract and view the table from the third page of the PDF
extract_tables(f1, pages = 3)[[1]] |> head()# A tibble: 6 × 7
`Table 1.a` ...2 ...3 General Inflation (%)(Base…¹ ...5 ...6 ...7
<chr> <chr> <chr> <chr> <chr> <chr> <chr>
1 <NA> <NA> <NA> CPI <NA> <NA> <NA>
2 <NA> <NA> General Food Non-… SPI** WPI
3 PERIOD National Urban Rural Urban Rural Urba… <NA> <NA>
4 <NA> YoY MoM YoY MoM YoY MoM YoY MoM YoY MoM YoY … YoY … YoY …
5 Aug-22 27.3 2.4 26.2 2.6 28.8 2.2 28.8 1.6 30.2 1.2 24.7… 34.0… 41.2…
6 Sep-22 23.2 -1.2 21.2 -2.1 26.1 0.2 30.8 5.2 32.7 5.7 15.2… 28.6… 38.9…
# ℹ abbreviated name: ¹`General Inflation (%)(Base 2015-16)`Table 2 indicates that the table has been successfully extracted from the PDF file. We can now proceed to convert this table into a data frame for further analysis.
Converting Extracted Table to Data Frame
After extracting the table, we need to convert it into a data frame and clean the data for further analysis.
Code
table <- extract_tables(f1, pages = 3)[[1]]

# Convert the extracted table to a data frame
table_df <- as.data.frame(table)

# Skip the first four rows
table_filtered <- table_df %>% slice(-(1:4))

# Combine the rows into a single text string
table_text <- apply(table_filtered, 1, paste, collapse = " ")

# Split the text into columns
table_separated <- str_split_fixed(table_text, "\\s+", n = 19)  # Adjust 'n' based on the number of columns

# Convert the separated text into a data frame
table_separated_df <- as.data.frame(table_separated)
Renaming Columns
We will now rename the columns to make the data more readable and meaningful.
Code
# Rename the columns of the data frame
colnames(table_separated_df) <- c(
  "Period",
  "CPI_general_yoy", "CPI_general_mom",
  "CPI_general_yoy_urban", "CPI_general_mom_urban",
  "CPI_general_yoy_rural", "CPI_general_mom_rural",
  "CPI_food_yoy_urban", "CPI_food_mom_urban",
  "CPI_food_yoy_rural", "CPI_food_mom_rural",
  "CPI_non_food_yoy_urban", "CPI_non_food_mom_urban",
  "CPI_non_food_yoy_rural", "CPI_non_food_mom_rural",
  "SPI_yoy", "SPI_mom",
  "WPI_yoy", "WPI_mom"
)
Cleaned Data Frame
Code
table_separated_df |> kableExtra::kable()| Period | CPI_general_yoy | CPI_general_mom | CPI_general_yoy_urban | CPI_general_mom_urban | CPI_general_yoy_rural | CPI_general_mom_rural | CPI_food_yoy_urban | CPI_food_mom_urban | CPI_food_yoy_rural | CPI_food_mom_rural | CPI_non_food_yoy_urban | CPI_non_food_mom_urban | CPI_non_food_yoy_rural | CPI_non_food_mom_rural | SPI_yoy | SPI_mom | WPI_yoy | WPI_mom |
|---|---|---|---|---|---|---|---|---|---|---|---|---|---|---|---|---|---|---|
| Aug-22 | 27.3 | 2.4 | 26.2 | 2.6 | 28.8 | 2.2 | 28.8 | 1.6 | 30.2 | 1.2 | 24.7 | 3.3 | 27.5 | 3.1 | 34.0 | 5.2 | 41.2 | 3.1 |
| Sep-22 | 23.2 | -1.2 | 21.2 | -2.1 | 26.1 | 0.2 | 30.8 | 5.2 | 32.7 | 5.7 | 15.2 | -6.6 | 20.1 | -4.9 | 28.6 | -1.4 | 38.9 | 1.4 |
| Oct-22 | 26.6 | 4.7 | 24.6 | 4.5 | 29.5 | 5.0 | 34.7 | 4.5 | 37.2 | 6.1 | 18.2 | 4.5 | 22.4 | 3.9 | 24.0 | -1.5 | 32.6 | -0.5 |
| Nov-22 | 23.8 | 0.8 | 21.6 | 0.4 | 27.2 | 1.3 | 29.7 | 0.0 | 33.5 | 0.5 | 16.4 | 0.6 | 21.4 | 2.1 | 27.1 | 6.1 | 27.7 | 0.0 |
| Dec-22 | 24.5 | 0.5 | 21.6 | 0.3 | 28.8 | 0.7 | 32.7 | 0.0 | 37.9 | 0.1 | 14.8 | 0.6 | 20.7 | 1.4 | 27.8 | 0.2 | 27.1 | -0.7 |
| Jan-23 | 27.6 | 2.9 | 24.4 | 2.4 | 32.3 | 3.6 | 39.0 | 3.9 | 45.2 | 5.7 | 15.6 | 1.2 | 20.9 | 1.5 | 30.5 | 1.3 | 28.5 | 1.8 |
| Feb-23 | 31.5 | 4.3 | 28.8 | 4.5 | 35.6 | 4.0 | 41.9 | 4.3 | 47.0 | 3.9 | 20.8 | 4.7 | 25.3 | 4.1 | 33.6 | 3.7 | 36.4 | 8.2 |
| Mar-23 | 35.4 | 3.7 | 33.0 | 3.9 | 38.9 | 3.5 | 47.1 | 5.6 | 50.2 | 4.5 | 24.1 | 2.7 | 28.5 | 2.4 | 40.4 | 5.8 | 37.5 | 4.7 |
| May-23 | 36.4 | 2.4 | 33.5 | 2.0 | 40.7 | 3.0 | 46.8 | 3.4 | 52.2 | 4.2 | 24.9 | 1.0 | 29.9 | 1.6 | 42.1 | 2.7 | 33.4 | 0.1 |
| May-23 | 38.0 | 1.6 | 35.1 | 1.5 | 42.2 | 1.7 | 48.1 | 1.9 | 52.4 | 1.4 | 26.6 | 1.2 | 32.5 | 2.0 | 43.0 | 1.3 | 32.8 | 1.0 |
| Jun-23 | 29.4 | -0.3 | 27.3 | 0.1 | 32.4 | -0.8 | 40.8 | 0.1 | 41.5 | -1.6 | 18.7 | 0.1 | 23.8 | 0.1 | 34.9 | 0.2 | 22.4 | -0.3 |
| Jul-23 | 28.3 | 3.5 | 26.3 | 3.6 | 31.3 | 3.3 | 40.2 | 3.7 | 41.3 | 3.5 | 17.3 | 3.5 | 22.0 | 3.0 | 29.3 | 2.8 | 23.1 | 2.5 |
| Aug-23 | 27.4 | 1.7 | 25.0 | 1.6 | 30.9 | 1.9 | 38.8 | 0.6 | 40.6 | 0.8 | 16.3 | 2.4 | 22.0 | 3.1 | 27.9 | 4.1 | 24.3 | 4.2 |
| Sep-23 | 31.4 | 2.0 | 29.7 | 1.7 | 33.9 | 2.5 | 33.9 | 1.5 | 35.4 | 1.8 | 26.8 | 1.8 | 32.3 | 3.2 | 32.0 | 1.7 | 26.4 | 3.1 |
| Oct-23 | 26.8 | 1.0 | 25.5 | 1.1 | 28.7 | 0.9 | 28.9 | 0.6 | 28.6 | 0.7 | 23.1 | 1.4 | 28.8 | 1.1 | 34.2 | 0.2 | 24.6 | -1.9 |
| Nov-23 | 29.2 | 2.7 | 30.4 | 4.3 | 27.5 | 0.4 | 29.8 | 0.8 | 29.2 | 1.0 | 30.9 | 7.0 | 25.9 | -0.2 | 30.6 | 3.3 | 26.4 | 1.4 |
| Dec-23 | 29.7 | 0.8 | 30.9 | 0.7 | 27.9 | 1.0 | 28.8 | -0.7 | 29.3 | 0.1 | 32.4 | 1.8 | 26.4 | 1.8 | 35.3 | 3.8 | 27.3 | 0.0 |
| Jan-24 | 28.3 | 1.8 | 30.2 | 1.8 | 25.7 | 1.9 | 27.4 | 2.8 | 25.1 | 2.3 | 32.3 | 1.1 | 26.3 | 1.4 | 36.2 | 2.0 | 27.0 | 1.5 |
| Feb-24 | 23.1 | 0.0 | 24.9 | 0.2 | 20.5 | -0.3 | 20.2 | -1.5 | 19.0 | -1.1 | 28.2 | 1.5 | 22.1 | 0.6 | 30.4 | -0.8 | 18.7 | 1.1 |
| Mar-24 | 20.7 | 1.7 | 21.9 | 1.4 | 19.0 | 2.1 | 16.6 | 2.4 | 17.1 | 2.8 | 25.8 | 0.7 | 21.0 | 1.4 | 25.9 | 2.1 | 14.8 | 1.3 |
| Apr-24 | 17.3 | -0.4 | 19.4 | -0.1 | 14.5 | -0.9 | 11.3 | -1.3 | 9.5 | -2.6 | 25.6 | 0.8 | 20.0 | 0.8 | 21.6 | -0.7 | 13.9 | -0.7 |
| May-24 | 11.8 | -3.2 | 14.3 | -2.8 | 8.2 | -3.9 | 2.2 | -6.3 | -0.1 | -7.4 | 23.6 | -0.4 | 17.2 | -0.4 | 15.3 | -4.0 | 9.9 | -2.5 |
Saving the Data to a CSV File and Excel File
Finally, we can save the cleaned data to a CSV file for future use.
Code
# Save the table to a CSV file
write.csv(table_separated_df, "table_separated_df.csv", row.names = FALSE)
# Save the table to an Excel file
writexl::write_xlsx(table_separated_df, "table_separated_df.xlsx")
Conclusion
In this post, we demonstrated how to extract tables from PDF files using the tabulapdf package in R. We walked through the steps of loading necessary libraries, extracting tables from PDFs, converting them to data frames, cleaning the data, and finally saving it to a CSV file. This process can be very useful for extracting and analyzing data from PDF reports and documents.