
Introduction
In the part 1 of extracting pdf tables, we discussed how to extract data from PDF files using the tabulapdf package in R. In this part, we will explore little more for extracting data from PDFs. We will also discuss how to handle more complex tables and extract data from PDFs.
We have same libraries as in the first part.
Required Libraries
I have tried tabulizer to install but not successful. I have come across tabulapdf package and find it very handy. To begin, we’ll need to install and load the necessary libraries. Here is the list of packages we’ll be using:
rJavatabulapdfpdftoolstidyverse
Let’s load these libraries in R.
Extracting Tables from a PDF
Now we will extract a table from page 10 from the same PDF file as in part 1. This PDF is a monthly report on Consumer Price Index from the Pakistan Bureau of Statistics.
Code
# URL of the monthly review PDF
f1 <- "https://www.pbs.gov.pk/sites/default/files/price_statistics/cpi/may/Monthly%20Review%20May%2C%202024.pdf"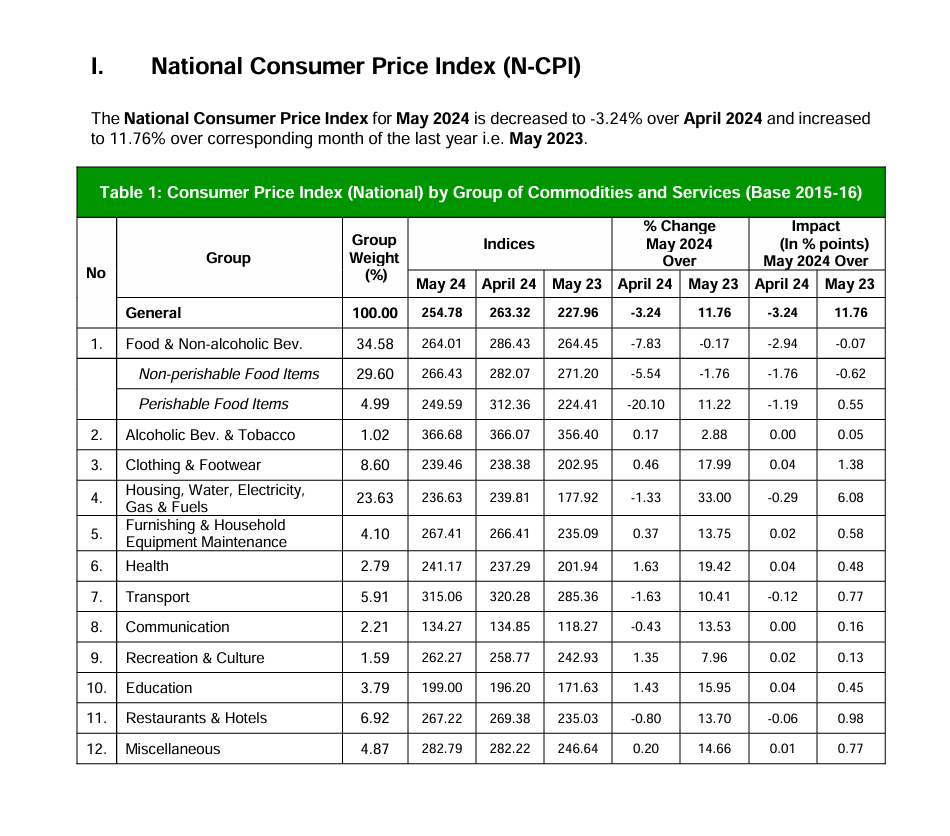
One can see from Figure 1 that the table we want to extract is on the third page of the PDF. Let’s extract the table from the third page of the PDF file.
Code
# Extract and view the table from the third page of the PDF
extract_tables(f1, pages =8 )[[1]] |> kableExtra::kable() |> kableExtra::kable_styling(bootstrap_options = c("striped", "hover", "condensed", "responsive"), full_width = F)| Table 1: Consumer Price Index (National) by Group of Commodities and Services (Base 2015-16) |
|---|
| % Change Impact |
| Group Indices May 2024 (In % points) |
| Group Weight Over May 2024 Over |
| No (%) |
| May 24 April 24 May 23 April 24 May 23 April 24 May 23 |
| General 100.00 254.78 263.32 227.96 -3.24 11.76 -3.24 11.76 |
| 1. Food & Non-alcoholic Bev. 34.58 264.01 286.43 264.45 -7.83 -0.17 -2.94 -0.07 |
| Non-perishable Food Items 29.60 266.43 282.07 271.20 -5.54 -1.76 -1.76 -0.62 |
| Perishable Food Items 4.99 249.59 312.36 224.41 -20.10 11.22 -1.19 0.55 |
| 2. Alcoholic Bev. & Tobacco 1.02 366.68 366.07 356.40 0.17 2.88 0.00 0.05 |
| 3. Clothing & Footwear 8.60 239.46 238.38 202.95 0.46 17.99 0.04 1.38 |
| Housing, Water, Electricity, |
| 4. 23.63 236.63 239.81 177.92 -1.33 33.00 -0.29 6.08 |
| Gas & Fuels |
| Furnishing & Household |
| 5. 4.10 267.41 266.41 235.09 0.37 13.75 0.02 0.58 |
| Equipment Maintenance |
| 6. Health 2.79 241.17 237.29 201.94 1.63 19.42 0.04 0.48 |
| 7. Transport 5.91 315.06 320.28 285.36 -1.63 10.41 -0.12 0.77 |
| 8. Communication 2.21 134.27 134.85 118.27 -0.43 13.53 0.00 0.16 |
| 9. Recreation & Culture 1.59 262.27 258.77 242.93 1.35 7.96 0.02 0.13 |
| 10. Education 3.79 199.00 196.20 171.63 1.43 15.95 0.04 0.45 |
| 11. Restaurants & Hotels 6.92 267.22 269.38 235.03 -0.80 13.70 -0.06 0.98 |
| 12. Miscellaneous 4.87 282.79 282.22 246.64 0.20 14.66 0.01 0.77 |
Table 1 is extracted from the PDF file in the same way as in Part 1. But all the data is in one column. One can adjust it as per requirement by some more coding. But we are showing an easy way to extract such data. We shall use first command get_page_dims to get the dimensions of the page and then use area to extract the table.
Code
get_page_dims(f1, pages = 8)[[1]]
[1] 595.32 841.92After getting page dimensions, we can extract the table by specifying the area of the table. One has to do some minor adjustments to get the desired table by specifying four values top, left, bottom, and right.
Code
library(data.table)
Data1 <-
  extract_tables(
    file  = f1
    , pages = 8
    , area  = list(c(180, 84, 470, 855)) # (top, left, bottom, right)
    , guess = FALSE
  ) [[1]] %>%
  as.data.table()

Data1 |> kableExtra::kable() |> kableExtra::kable_styling(bootstrap_options = c("striped", "hover", "condensed", "responsive"), full_width = F) | ...1 | ...2 | May 24 | April 24...4 | May 23...5 | April 24...6 | May 23...7 | April 24...8 | May 23...9 |
|---|---|---|---|---|---|---|---|---|
| General | 100.00 | 254.78 | 263.32 | 227.96 | -3.24 | 11.76 | -3.24 | 11.76 |
| Food & Non-alcoholic Bev. | 34.58 | 264.01 | 286.43 | 264.45 | -7.83 | -0.17 | -2.94 | -0.07 |
| Non-perishable Food Items | 29.60 | 266.43 | 282.07 | 271.20 | -5.54 | -1.76 | -1.76 | -0.62 |
| Perishable Food Items | 4.99 | 249.59 | 312.36 | 224.41 | -20.10 | 11.22 | -1.19 | 0.55 |
| Alcoholic Bev. & Tobacco | 1.02 | 366.68 | 366.07 | 356.40 | 0.17 | 2.88 | 0.00 | 0.05 |
| Clothing & Footwear | 8.60 | 239.46 | 238.38 | 202.95 | 0.46 | 17.99 | 0.04 | 1.38 |
| Housing, Water, Electricity, | NA | NA | NA | NA | NA | NA | NA | NA |
| NA | 23.63 | 236.63 | 239.81 | 177.92 | -1.33 | 33.00 | -0.29 | 6.08 |
| Gas & Fuels | NA | NA | NA | NA | NA | NA | NA | NA |
| Furnishing & Household | NA | NA | NA | NA | NA | NA | NA | NA |
| NA | 4.10 | 267.41 | 266.41 | 235.09 | 0.37 | 13.75 | 0.02 | 0.58 |
| Equipment Maintenance | NA | NA | NA | NA | NA | NA | NA | NA |
| Health | 2.79 | 241.17 | 237.29 | 201.94 | 1.63 | 19.42 | 0.04 | 0.48 |
| Transport | 5.91 | 315.06 | 320.28 | 285.36 | -1.63 | 10.41 | -0.12 | 0.77 |
| Communication | 2.21 | 134.27 | 134.85 | 118.27 | -0.43 | 13.53 | 0.00 | 0.16 |
| Recreation & Culture | 1.59 | 262.27 | 258.77 | 242.93 | 1.35 | 7.96 | 0.02 | 0.13 |
| Education | 3.79 | 199.00 | 196.20 | 171.63 | 1.43 | 15.95 | 0.04 | 0.45 |
| Restaurants & Hotels | 6.92 | 267.22 | 269.38 | 235.03 | -0.80 | 13.70 | -0.06 | 0.98 |
| Miscellaneous | 4.87 | 282.79 | 282.22 | 246.64 | 0.20 | 14.66 | 0.01 | 0.77 |
Table 2 is almost the same as reported in Figure 1 unlike Table 1 which has all data in one column. However, some adjustments are still required. We have first column names with some specific symbols so its names are spread in more than one rows. To remove rows with NAs and adjusting row names, we can do some wrangling.
Code
colnames(Data1) <- c("Group", " Group Weight", "index_may_2024", "index_apr_2024", "index_may_2023", "index_may_2024_mom", "index_may_2024_yoy",
                      "impact_apr_2024", "impact_may_2023")
Data2 <- Data1 %>%
  mutate(
    Group = case_when(
      is.na(Group) & row_number() == 8 ~ "Housing, Water, Electricity, Gas & Other",
      is.na(Group) & row_number() == 11 ~ "Furnishing & Household Equip. & Maintenance",
      TRUE ~ Group
    )
  )
Code
## Remove rows with missing values

Data3 <- Data2 |> drop_na()

## Cleaned Data Frame
Data3 |> kableExtra::kable() |> kableExtra::kable_styling(bootstrap_options = c("striped", "hover", "condensed", "responsive"), full_width = F) | Group | Group Weight | index_may_2024 | index_apr_2024 | index_may_2023 | index_may_2024_mom | index_may_2024_yoy | impact_apr_2024 | impact_may_2023 |
|---|---|---|---|---|---|---|---|---|
| General | 100.00 | 254.78 | 263.32 | 227.96 | -3.24 | 11.76 | -3.24 | 11.76 |
| Food & Non-alcoholic Bev. | 34.58 | 264.01 | 286.43 | 264.45 | -7.83 | -0.17 | -2.94 | -0.07 |
| Non-perishable Food Items | 29.60 | 266.43 | 282.07 | 271.20 | -5.54 | -1.76 | -1.76 | -0.62 |
| Perishable Food Items | 4.99 | 249.59 | 312.36 | 224.41 | -20.10 | 11.22 | -1.19 | 0.55 |
| Alcoholic Bev. & Tobacco | 1.02 | 366.68 | 366.07 | 356.40 | 0.17 | 2.88 | 0.00 | 0.05 |
| Clothing & Footwear | 8.60 | 239.46 | 238.38 | 202.95 | 0.46 | 17.99 | 0.04 | 1.38 |
| Housing, Water, Electricity, Gas & Other | 23.63 | 236.63 | 239.81 | 177.92 | -1.33 | 33.00 | -0.29 | 6.08 |
| Furnishing & Household Equip. & Maintenance | 4.10 | 267.41 | 266.41 | 235.09 | 0.37 | 13.75 | 0.02 | 0.58 |
| Health | 2.79 | 241.17 | 237.29 | 201.94 | 1.63 | 19.42 | 0.04 | 0.48 |
| Transport | 5.91 | 315.06 | 320.28 | 285.36 | -1.63 | 10.41 | -0.12 | 0.77 |
| Communication | 2.21 | 134.27 | 134.85 | 118.27 | -0.43 | 13.53 | 0.00 | 0.16 |
| Recreation & Culture | 1.59 | 262.27 | 258.77 | 242.93 | 1.35 | 7.96 | 0.02 | 0.13 |
| Education | 3.79 | 199.00 | 196.20 | 171.63 | 1.43 | 15.95 | 0.04 | 0.45 |
| Restaurants & Hotels | 6.92 | 267.22 | 269.38 | 235.03 | -0.80 | 13.70 | -0.06 | 0.98 |
| Miscellaneous | 4.87 | 282.79 | 282.22 | 246.64 | 0.20 | 14.66 | 0.01 | 0.77 |
Table 3 is the cleaned data frame. We have adjusted column names and removed rows with missing values. One can use columns names as per one’s requirement.
Saving the Data to a CSV File and Excel File
Finally, we can save the cleaned data to a CSV and excel file for future use.
Code
write.csv(Data3, "CPI.csv", row.names = FALSE)
writexl::write_xlsx(Data3, "CPI.xlsx")